
Care Home CQC Safe Domain Analytics: What It Covers and Why It Matters, Article 11 of 12
Care Home Analytics Series — Part 11 of 12
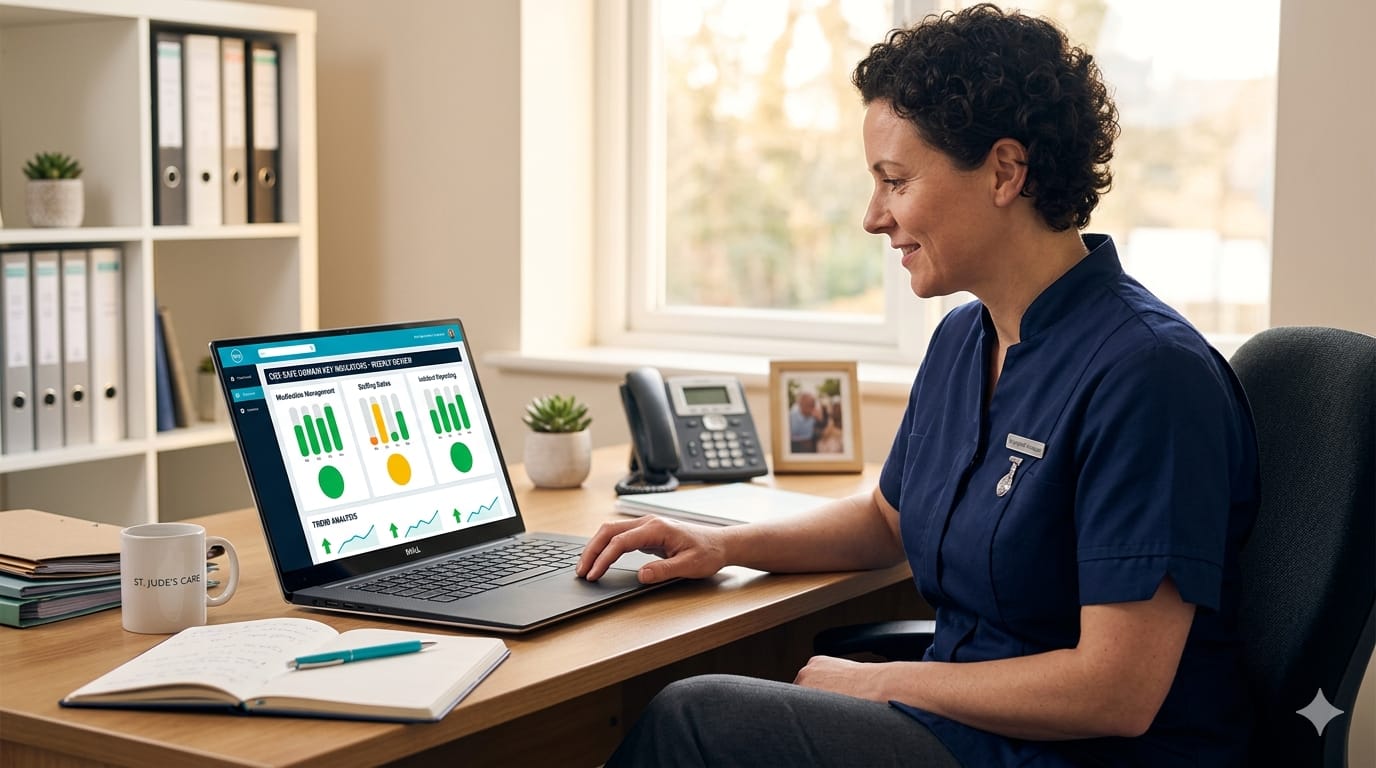
Care home CQC Safe domain analytics is the application of live Power BI dashboards to the full range of safety evidence that CQC inspectors assess under the Safe domain of the Single Assessment Framework. This includes incident and accident rates, infection prevention and control (IPC) compliance, individual risk assessment currency, restraint and restrictive practice recording, and environmental safety audit completion.
The Safe domain is the most frequently rated Requires Improvement domain in UK care home inspections. This is not because care homes are systematically unsafe — it is because safety evidence is the hardest to compile consistently without dedicated analytics infrastructure. Without a live dashboard pulling all of this together, registered managers are always playing catch-up.
The 6 Core Metrics in Care Home Safe Domain Analytics
Incident and accident rates — total incidents per month, broken down by type (falls, medication errors, behaviours that challenge, unexplained injuries, safeguarding concerns), with trend analysis over 12 months. Any month where incident rates exceed two standard deviations from the 12-month mean triggers an automatic management alert. Infection prevention and control — IPC audit completion rates, compliance scores by area of the home, hand hygiene observation results, and outbreak management records. Individual risk assessment currency — whether every resident has a current risk assessment covering falls, pressure areas, nutrition, moving and handling, and behaviour support. Restraint and restrictive practice — all recorded instances with associated MCA assessments and Best Interests decisions. Environmental safety — fire safety check completion, call bell response time monitoring, equipment maintenance records. Near miss recording — near miss events analysed to identify precursor patterns before actual adverse events occur.
Infection Control Analytics: A Post-Pandemic Priority
Since COVID-19, infection prevention and control has become a standalone area of CQC scrutiny. The CQC’s IPC audit tool requires homes to demonstrate robust processes for outbreak management, PPE availability and usage, and staff training in standard infection control precautions.
A care home safe domain analytics dashboard with an IPC module tracks audit completion dates and compliance scores across all domains. Visit our care home analytics and Power BI pages. See CQC guidance on safe care and treatment.
Frequently Asked Questions
What is care home CQC Safe domain analytics?
Care home CQC Safe domain analytics is the use of live Power BI dashboards to track all evidence relevant to the CQC Safe domain — incident rates, infection control compliance, risk assessment currency, restrictive practice recording, and environmental safety audit completion — in real time.
Why is the Safe domain the most common CQC Requires Improvement area for care homes?
The Safe domain generates the most Requires Improvement ratings because safety evidence is multidimensional and time-sensitive — incident rates, risk assessments, and infection control compliance all need continuous monitoring. Without analytics infrastructure, gaps accumulate undetected until an inspector identifies them.
How does Power BI track infection control compliance in a care home?
Power BI connects to your IPC audit records and presents completion rates, compliance scores by home area, and outbreak management records in a live dashboard. For multi-site providers, cross-site IPC benchmarking identifies variation and directs improvement resources effectively.
What incident rate should trigger management review in a care home?
Quematics builds statistical process control (SPC) alerting into our care home analytics dashboards — an automatic alert fires when any metric exceeds two standard deviations from its 12-month mean. This evidence-based threshold eliminates arbitrary targets and aligns with NHS patient safety methodology.
How does Safe domain analytics support a Good CQC rating?
Good Safe domain ratings consistently feature evidence of systematic, proactive safety oversight — not just reactive incident management. A live analytics dashboard demonstrating continuous monitoring, trend analysis, and prompt management response to safety signals provides exactly this evidence.
See How Care Homes Use Power BI to Prepare for CQC Inspections

Mohsin Farhat
AI & Data Analytics Leader | 15+ years in Data Analytics, Automation & Decision Intelligence | Healthcare • NHS • Public & Private Sector
Connect on LinkedIn


